Institutions Dashboard
The panel where an institution operates its AI suite. Doc, the students' tutor, and the teachers' Instructional Assistant live inside the LMS; here they get configured, measured and turned into evidence. I designed it from scratch with stakeholders, engineering and data.
⌐ THE DEMOS ARE INTERACTIVE RECONSTRUCTIONS — THE REAL PROTOTYPE, AT THE END OF THE CASE
The suite lives in the LMS. The institution operates from here.
For students and teachers the suite is invisible: it works inside the virtual campus they already use, zero friction. The institution that signs the contract needs the opposite: a surface of its own to see adoption, manage its access and take away evidence. The dashboard was born alongside the suite to be that surface.
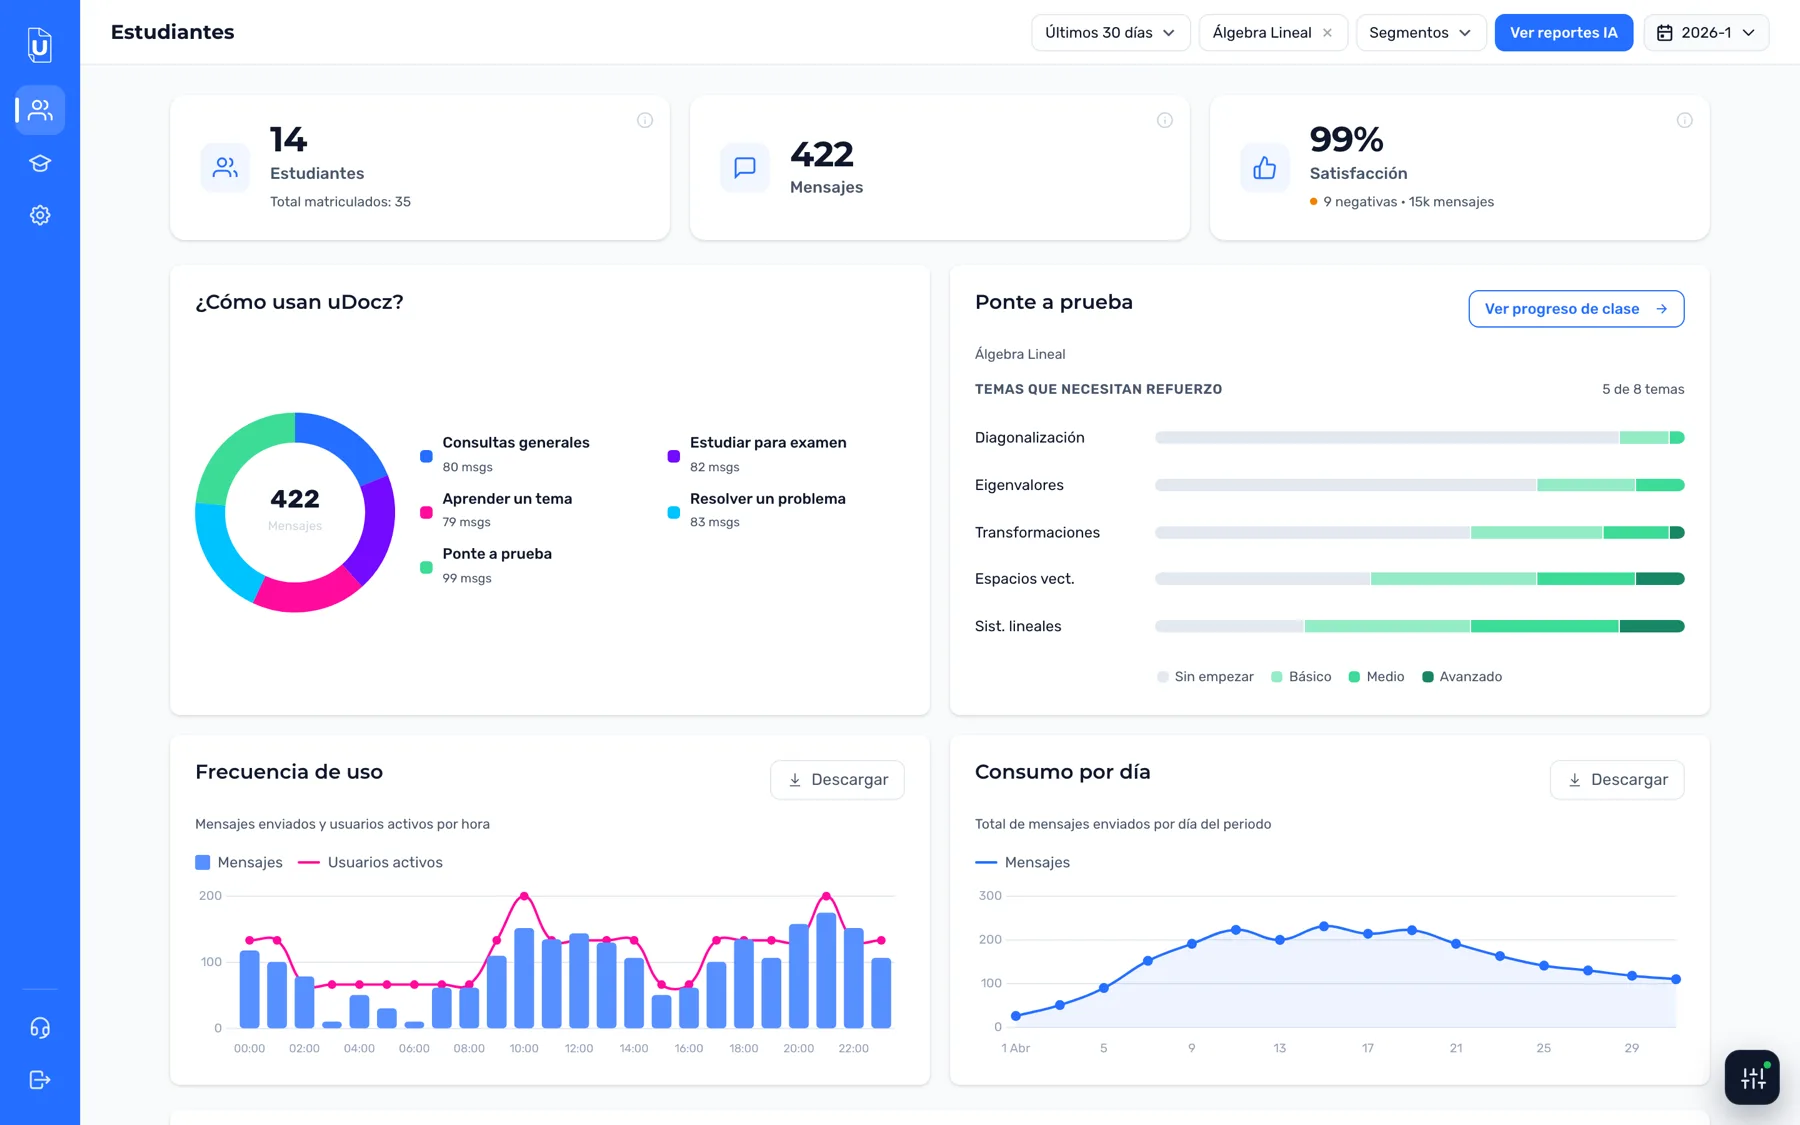
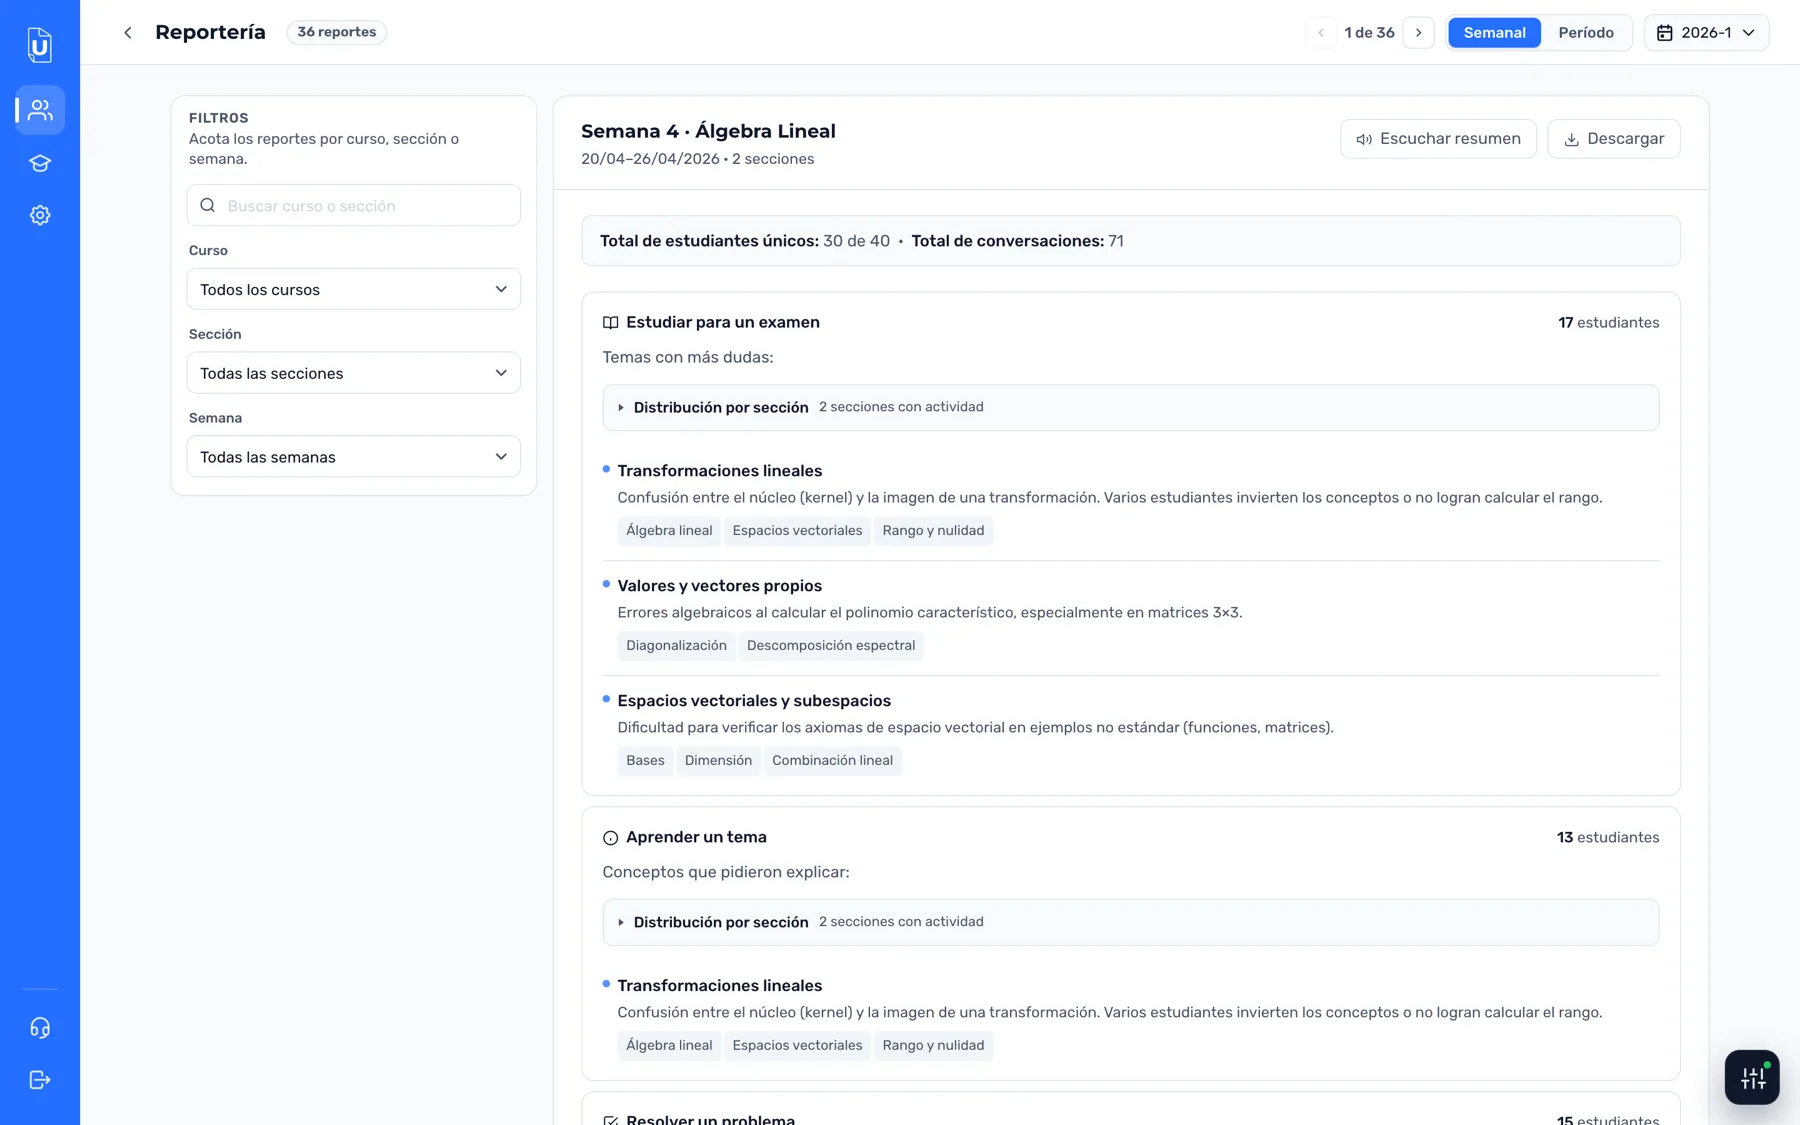
And what does it show? Intent, not grades. The axis of the reporting is the five usage modes: asking about linear transformations to learn is not the same as asking the night before the exam. It's the donut at the center of the board below.
Two fields, four checks — the LMS does the rest.
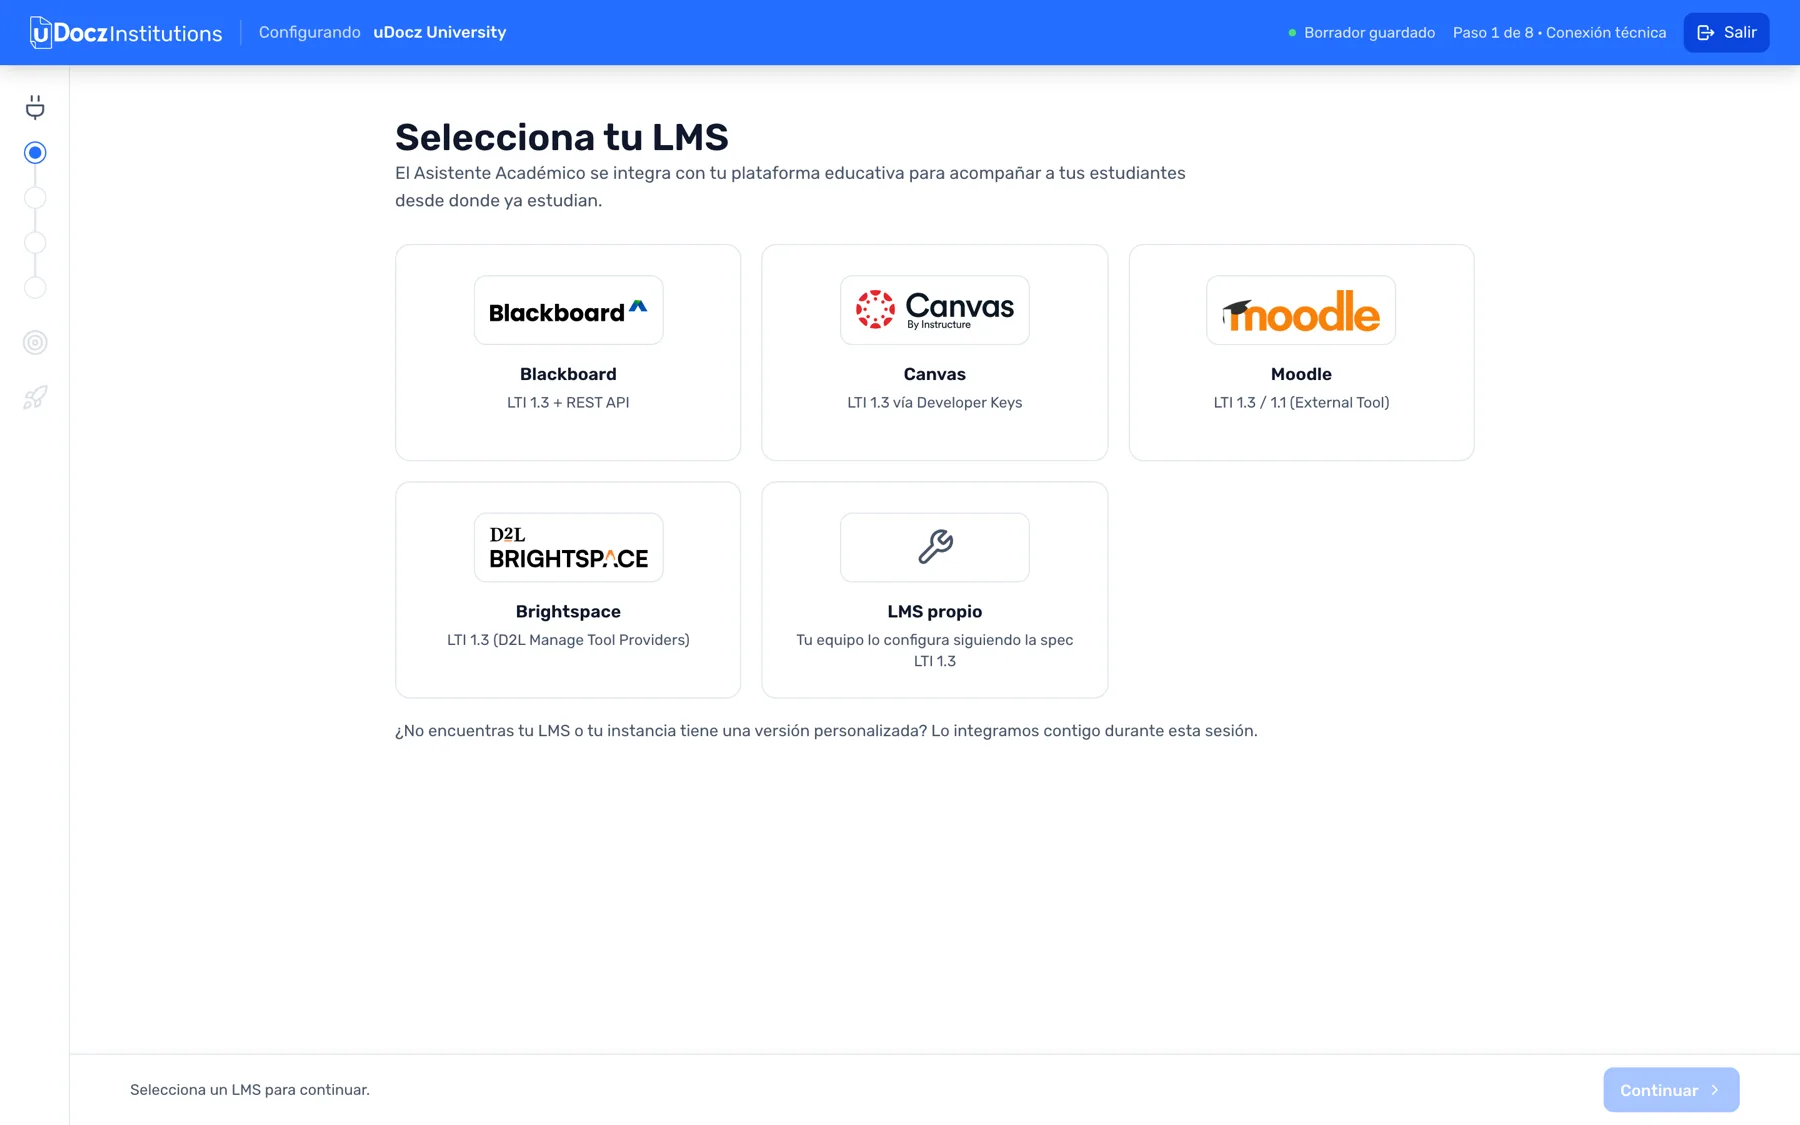
The connection is LTI 1.3: Canvas, Moodle, Blackboard, Brightspace. In the three-phase onboarding the institution gives two things, the LMS URL and the deployment id. The connection tests itself with four live checks: LTI identity, authorization token, roster read and API heartbeat.
The whole system flows through that connection: LTI contexts feed the reporting, and syllabi feed Doc's knowledge.
Each role enters a different panel.
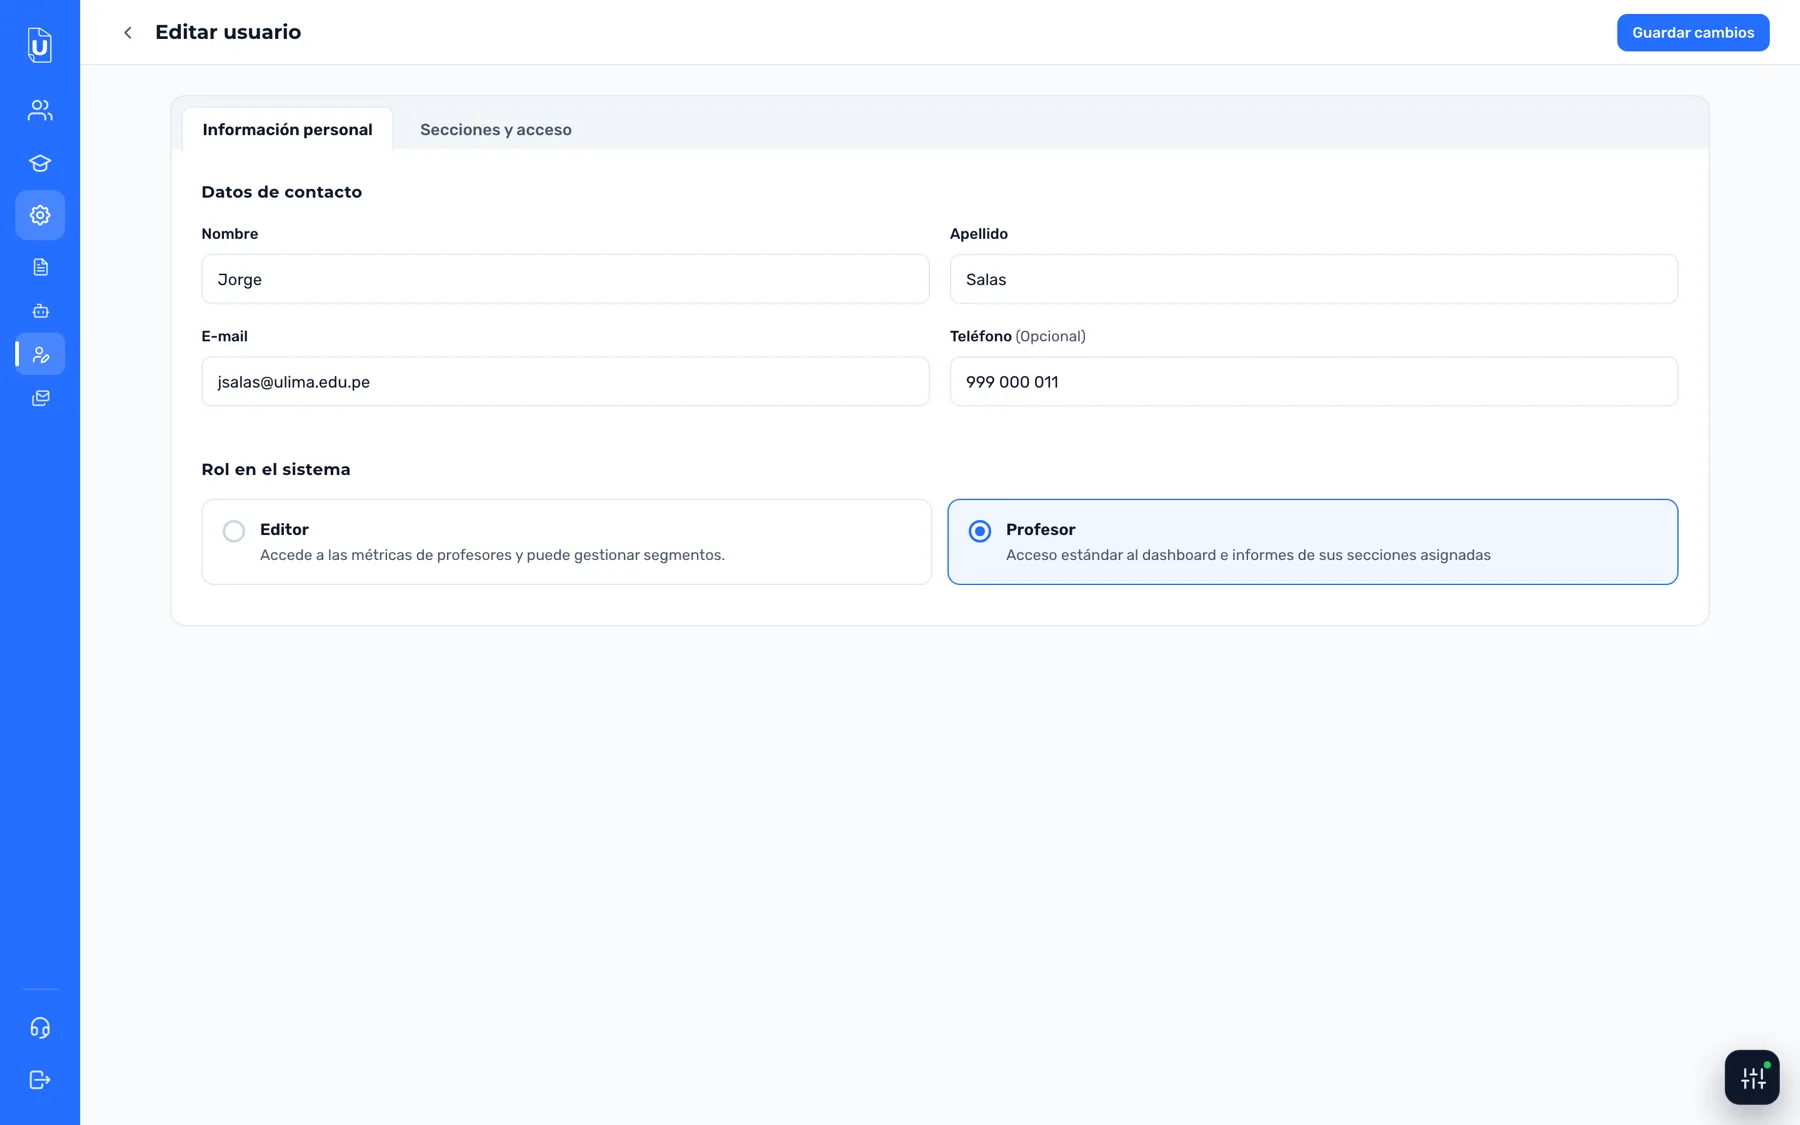
Who gets into the panel is one thing; how much they see is another. The first is set by the product; the second is managed by the institution itself from the Users module, without depending on uDocz. It assigns admin, editor or teacher, with specific sections or all of them.
- The director operates the whole institution: users, reports for every section, letterheaded PDF evidence for accreditation, and the on/off switch and audience of the communications. The only thing they don't touch is the AI's content: they see Doc's customization as a read-only summary, with "Request edit" one click away.
- The editor works over a group of sections. Segments, named collections of sections, save them from building the same filter every time: a single one filters the whole panel.
- The teacher comes in from the LMS, next to their other tools, and the panel narrows itself: reports and views for their sections, nothing new to learn.
- The uDocz team sees and configures everything from the Admin Hub, a separate console the client never sees.
uDocz configures; the institution sees the summary.
Customization is the uDocz team's job: it configures each assistant, the students' and the teachers', from a hub with four tabs. The director doesn't edit: they see a read-only summary of what is configured and a "Request edit" button. The context of a bot that accompanies students is delicate, and whoever writes it is whoever knows how the model answers.
- General is the identity: name and avatar, which usage modes can be turned on, informed consent and language per course. The baseline is Spanish and overrides are the exception, in an accordion that holds more than a thousand sections. It closes with the additional instructions: broad prompts written by uDocz — tone, academic integrity, source citation.
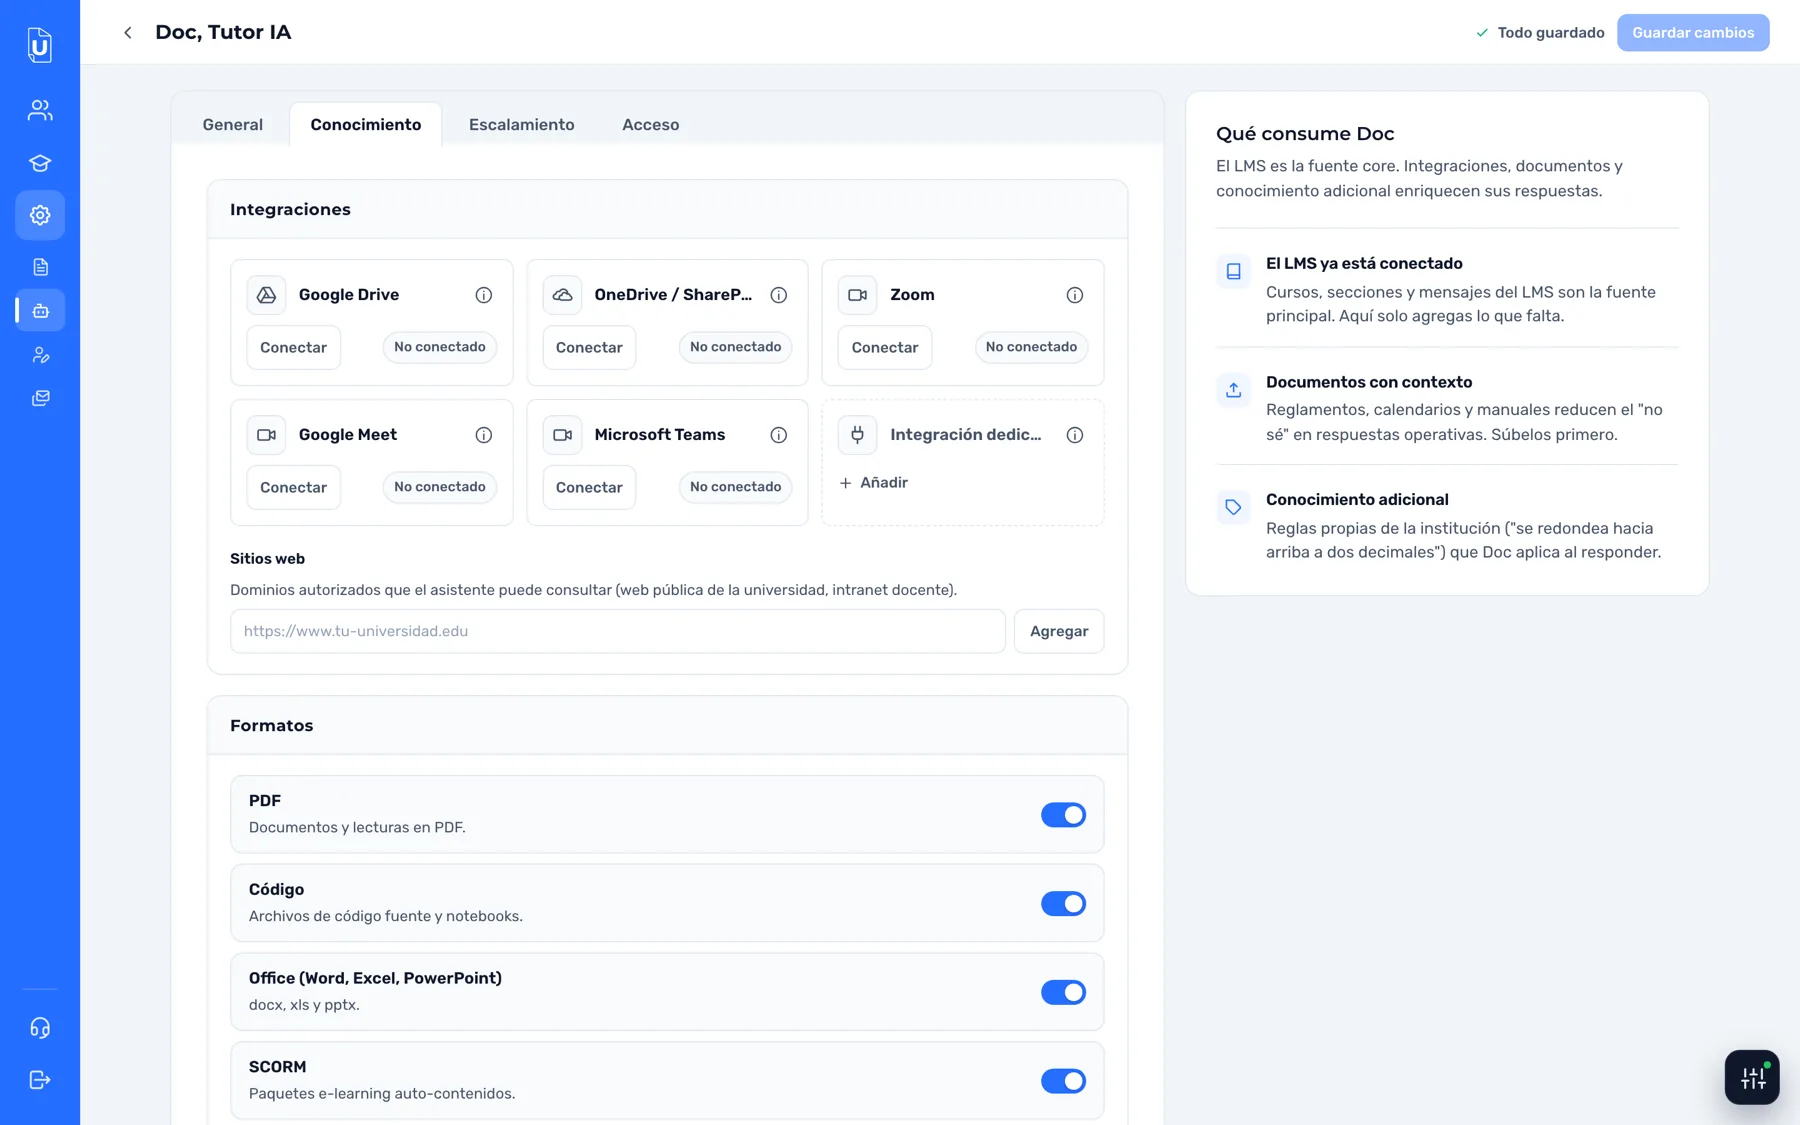
- Knowledge is the context, the key part. Integrations (Drive, Zoom, the institution's SIS), formats it can read, allowed websites, the institution's own documents such as policies and manuals, and open rules specific to the institution.
- Escalation: when the conversation touches socio-emotional topics, Doc hands off to a human — with an editable handoff message and a responsible contact.
- Access: where the assistant lives — the installed LMS, or embedded by URL on any site — and which channels it speaks through.
The right half is a live preview that replicates the chat as it looks embedded in the LMS, with the institution's color injected. Two rules hold that panel together. Blue is reserved for CTAs and switches: it's the only state with color, selected items go neutral. And everything binary is a row with a switch; the checkbox stays for multiple selection only.
Customization started with seven tabs; today there are four. The three cuts, each with its reason on record, are at the end of the case.
Specified in text, delivered as a navigable prototype.
The panel exists in two formats. As 28 documents: each module separates its product document (what it is and why) from the technical one (how it behaves), with the wireframes drawn in ASCII inside the same spec. And as a navigable prototype in HTML, CSS and JS with no framework, with synthetic data. That prototype is the handoff: engineering doesn't read an image, it opens the view.
It consumes the design system as a submodule pinned to a version, with a bridge layer declared temporary. The dashboard's old variables point at canonical tokens so seven thousand lines of CSS don't get rewritten at once; the bridge shrinks with every release.
The same format sustains the iteration. A stage closes with leadership's sign-off and gets frozen in an archive branch. The audit that follows happens on the navigable prototype, working product and not mockups, and every comment lands as its own PR. Anyone who wants to know why something changed reads it in the history.
What got left behind along the way.
Iterating also means letting go, as in any product, always with engineering and leadership at the table. The piece with the longest history is "risk": three versions of the same question (how is this student doing?), each one more honest with the data available. The demo tells all three.
The rest, in short:
- Faculty, program and modality as reporting fields: the LMS doesn't deliver them; the view was redone with what does arrive.
- Three customization tabs: Messages promised control over text the model generates; Behavior and Rules were instructions disguised as controls; today they get written in General.
- Dark mode: 238 rules to review on every change, for a panel used during the day. Archived in its own branch.
- The feedback module: the satisfaction KPI answered the same thing with less surface.
The real prototype, view by view.
The demos above are reconstructed to tell the design. This is the prototype exactly as it runs: six of its fifteen views, with synthetic data. Click to open large.